Dashboard Overview
The Brandstorm dashboard is your central command center. View key metrics, recent activity, platform analytics, and access quick actions — all in one place.
Overview
The dashboard is the first page you see after logging in. It provides a high-level snapshot of your content performance, connected platform analytics, and quick access to key areas of the application. The dashboard content is context-aware — it filters data based on the active brand selection.
Key Features
Brand Context Filtering
Filter all dashboard data by a specific brand using the Active Brand Context dropdown.
Real-time Metrics
Key performance indicators update automatically as you create and publish content.
Platform Integration
View analytics from all connected social platforms in one unified view.
Quick Actions
One-click access to content creation, calendar, and brand settings.
Account Context
The top section of the dashboard displays your account summary. It shows your account type (Individual or Company), account name, your role, and the number of team members for company accounts. The account ID is displayed in the top-right corner.

Company accounts additionally show a Team Members section below the header, listing team members with their names and roles.
Brand Context
If you manage multiple brands, the Active Brand Context dropdown lets you filter all dashboard data to a specific brand. This ensures metrics, content, and analytics reflect the selected brand's data only.
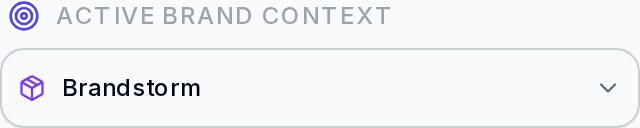
The welcome message also personalizes based on the time of day and the selected brand. Company accounts see “Managing content for…” while individual accounts see “Here’s a snapshot…”
Quick Stats
Five stat cards provide an at-a-glance summary of your performance. Each card shows an icon, label, and count.
Total Content
Total Followers
Active Campaigns
Scheduled
Published

Recent Content
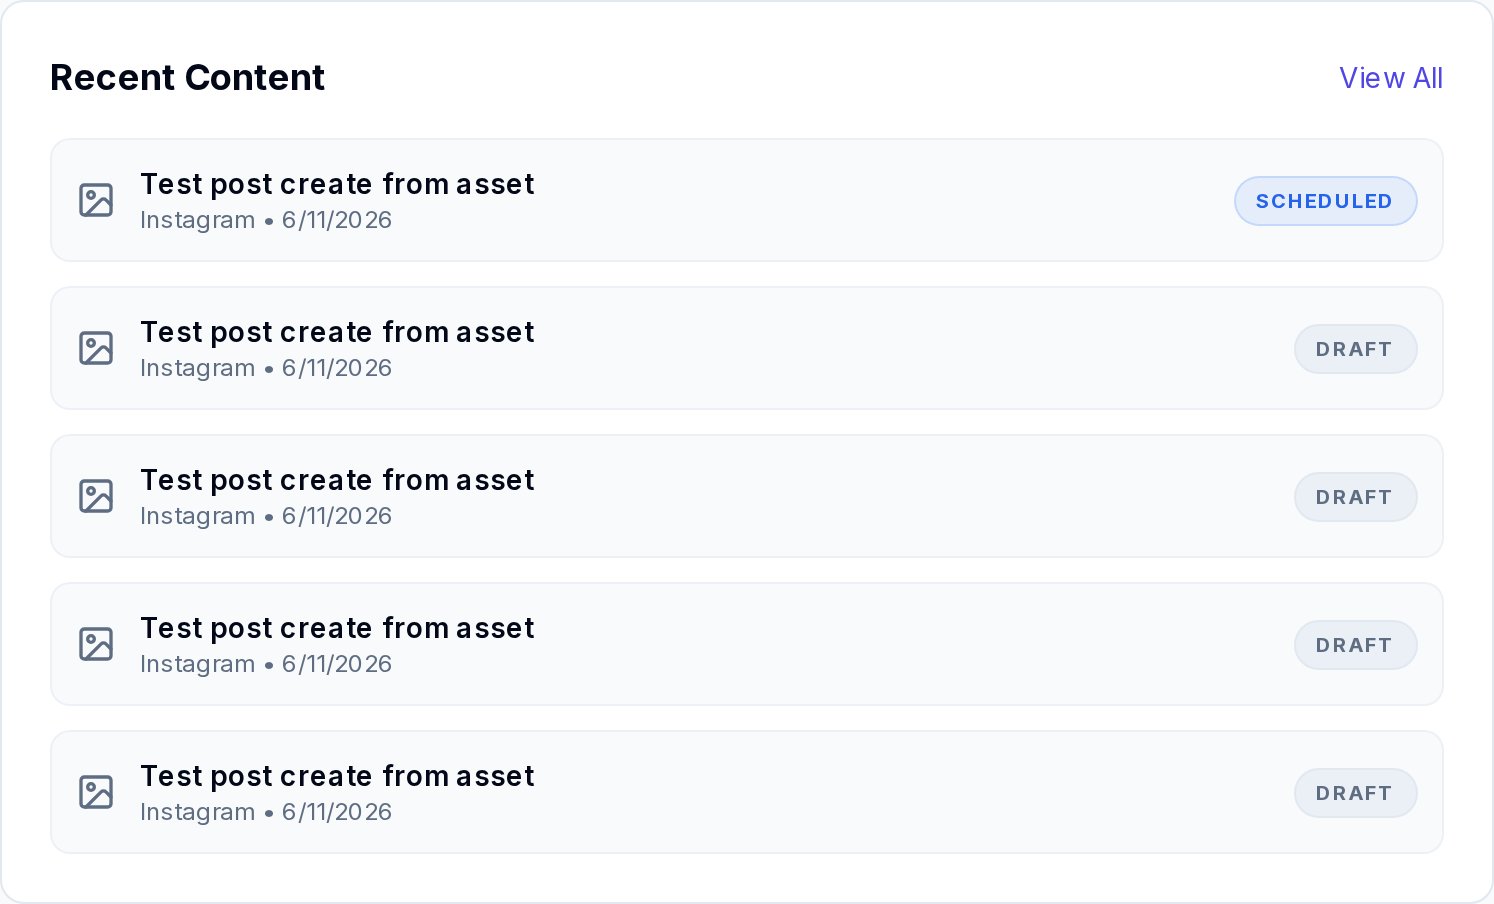
The Recent Content panel (left column) lists the 5 most recently created items. Each entry includes:
- Content type icon (Text, Image, or Video)
- Title of the content piece
- Target platform and creation date
- Status badge: DRAFT, SCHEDULED, or PUBLISHED
Click View All to open the full Content Library.
Recent Campaigns
The Recent Campaigns panel (right column) shows your most recently created campaigns, with campaign name and goal description. Click View All to manage all campaigns.
Platform Analytics
This section displays performance metrics for each connected social platform. For every connected account, you can view:
- Impressions — Total number of times content was viewed
- Engagement Rate — Percentage of viewers who interacted with content
- Followers — Current follower count
Each platform card displays the platform icon, name, and these three metrics. If no platforms are connected, a call-to-action button directs you to the Connections page.
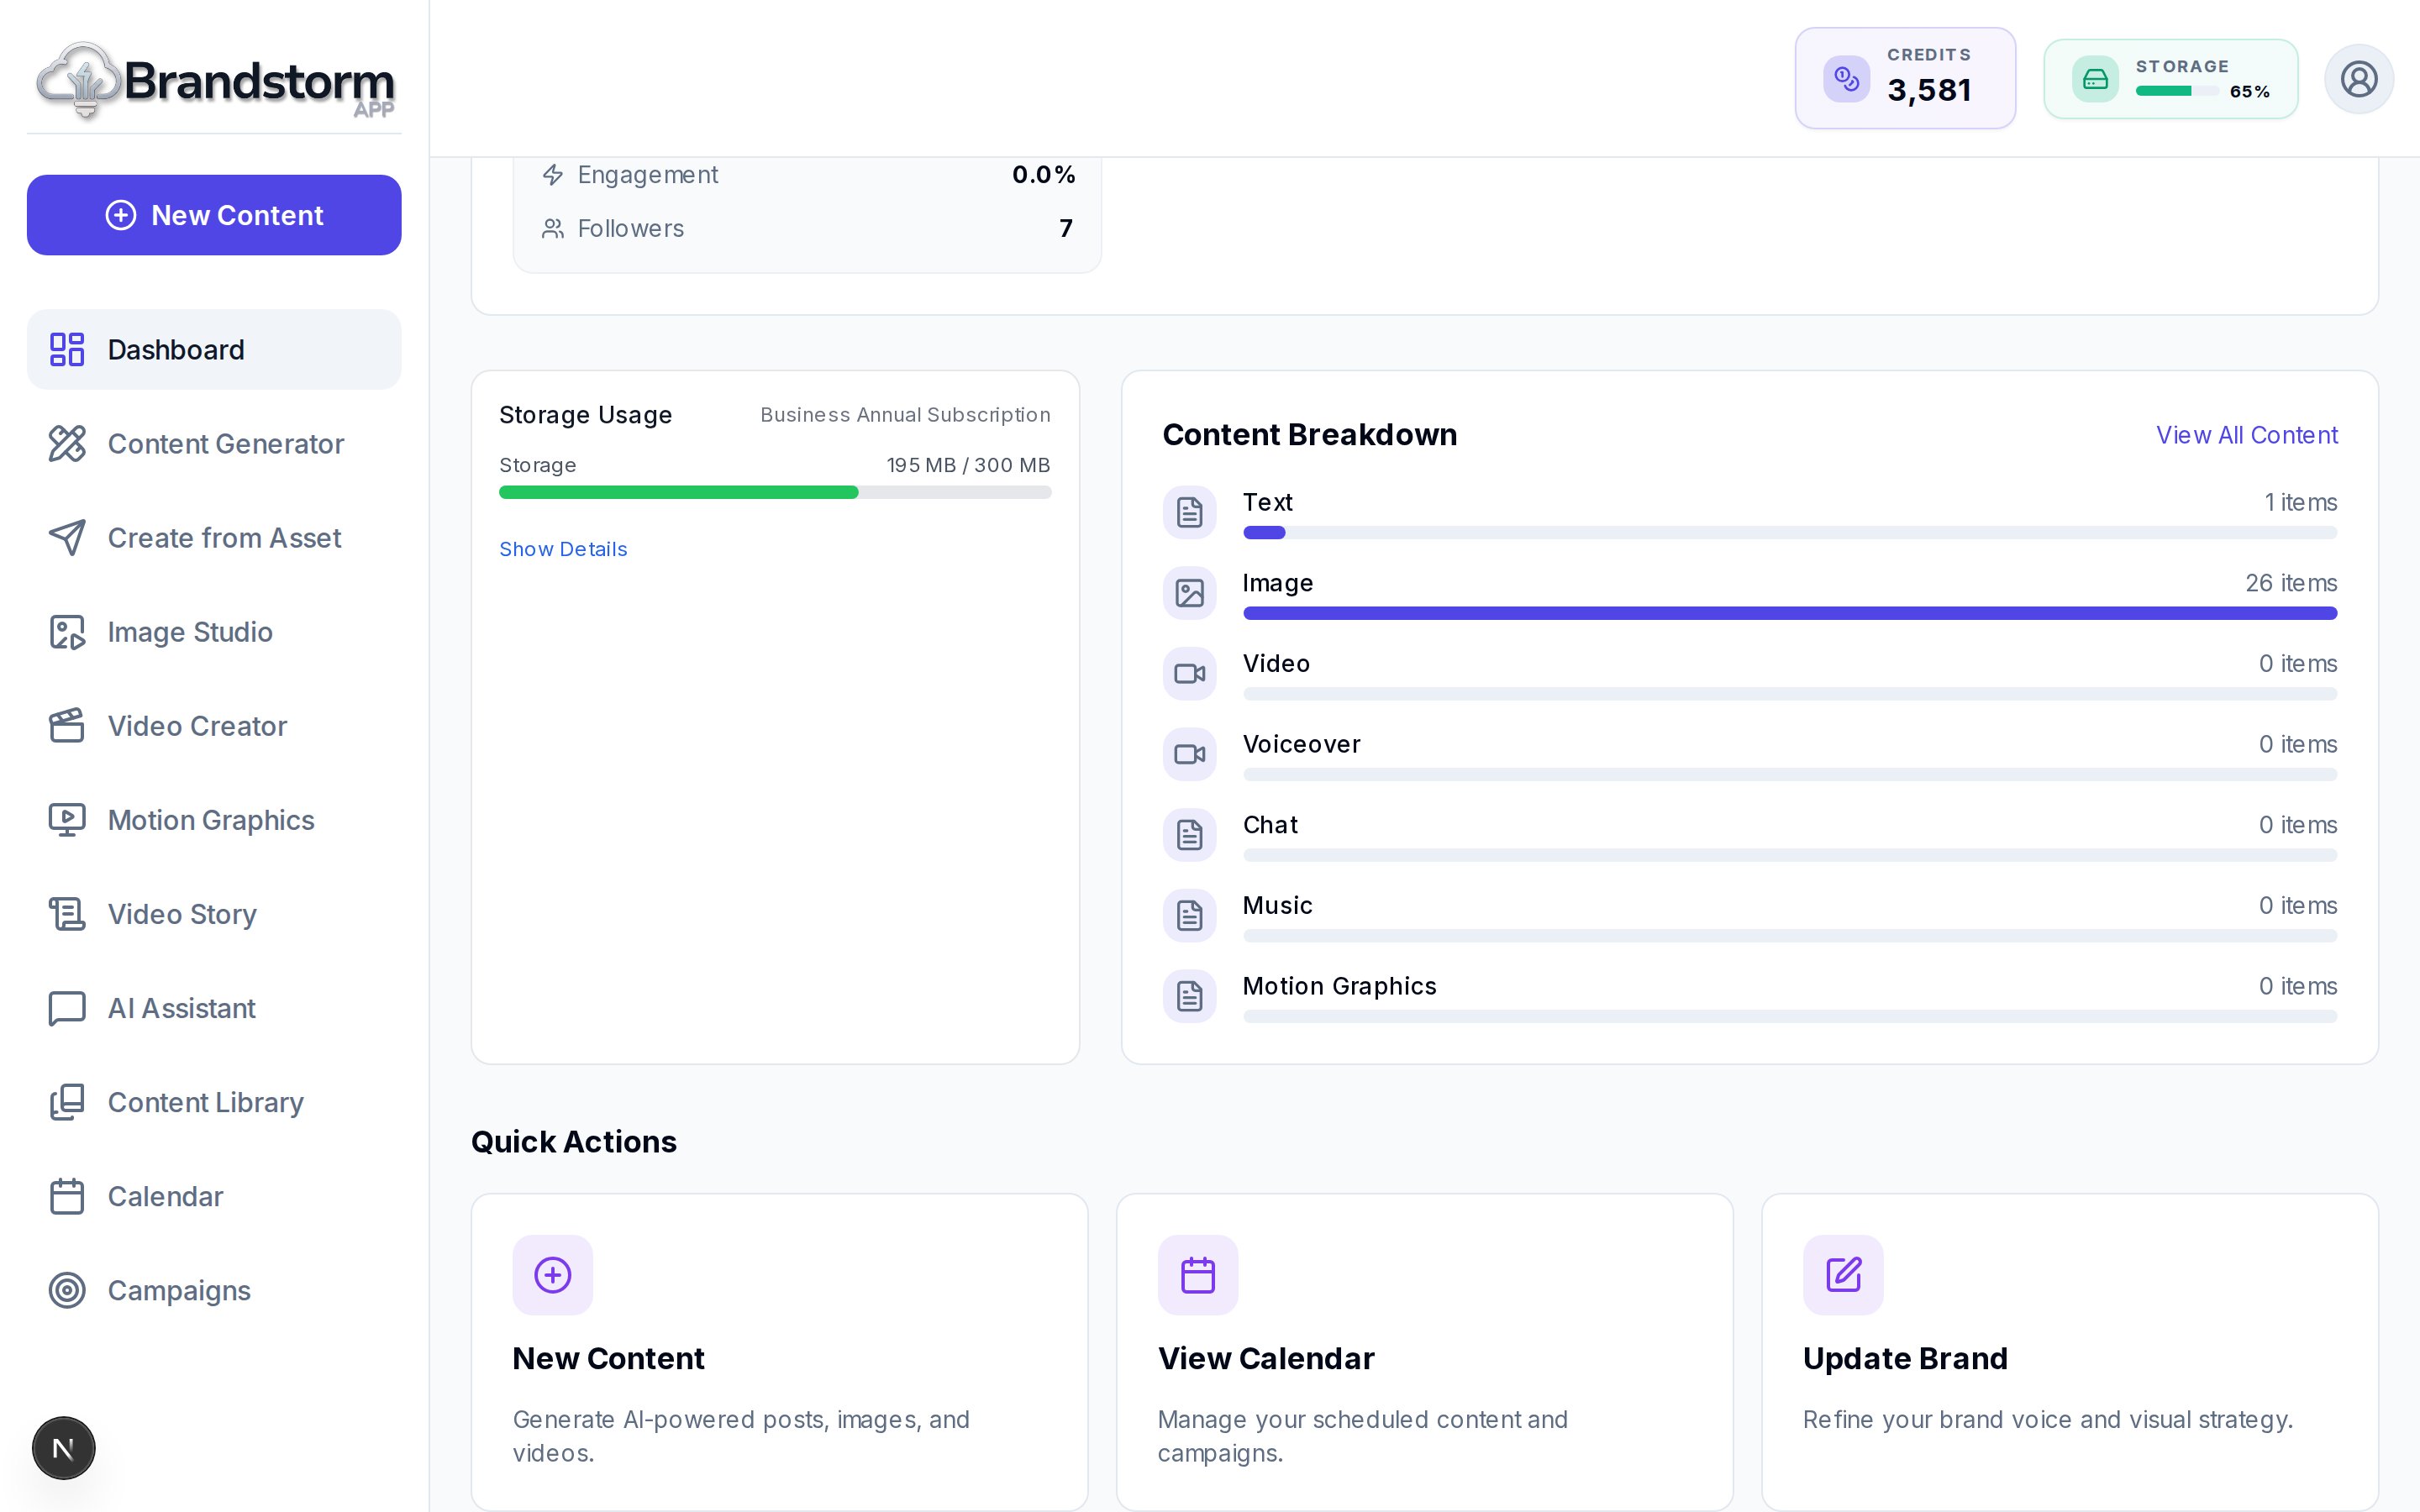
Storage & Content Breakdown
The bottom section has two columns:
- Storage Status (left): Shows your current plan usage with an upgrade prompt if needed.
- Content Breakdown (right): A visual bar chart showing your content distribution by type (Text, Image, Video, Voiceover, Chat). Each bar indicates the count and percentage relative to the most common type.
Quick Actions
Three quick-action cards provide one-click navigation to frequently used features:
New Content
Opens the Content Generator to create AI-powered posts, images, and videos.
View Calendar
Opens the Content Calendar to manage scheduled posts and campaigns.
Update Brand
Takes you to Brand Identity settings to refine your brand voice and visuals.
Tips & Best Practices
- ✦Use brand context filtering: If you manage multiple brands, always check the Active Brand Context dropdown. Dashboard data is filtered by the selected brand.
- ✦Refresh for latest data: The dashboard fetches data on page load. Refresh the page if you've made changes in another tab.
- ✦Connect all platforms: The Platform Analytics section is most useful when all your social accounts are connected. Visit the Connections page to link them.
- ✦Monitor storage usage: Keep an eye on the Storage Status widget to avoid hitting plan limits during active campaigns.
FAQ
Why is my dashboard showing no data?
Ensure you have created content and connected social accounts. Also check that the correct brand is selected in the Active Brand Context dropdown.
How often does dashboard data update?
Data is fetched when the page loads. For real-time updates, you may need to refresh the page. The Platform Analytics section also updates on load.
Can I customize which stats appear on the dashboard?
Currently the dashboard displays a fixed set of metrics. Customization options are planned for future releases.
What does the BETA badge on Platform Analytics mean?
The Platform Analytics feature is in active development. You may see incomplete data or changes as we improve the feature. Feedback is welcome.